
Gekko Strategies #
Gekko uses technical analysis indicators inside strategies.
This investment advice is going to be either long or short. Long indicates that Gekko the asset should be bought and short indicates that it should be sold.
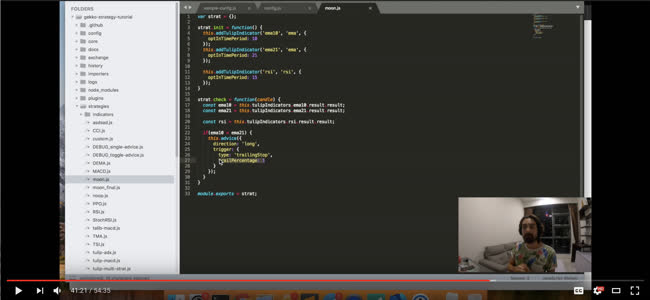
If you are familiar with javascript you can easily create your own strategies. Here is a video explaining everything you need to know:
Below you can find simple and exemplary strategies that come with Gekko. These strategies come with Gekko and serve as examples.
Gekko currently comes with the following example strategies:
DEMA #
This strategy uses Exponential Moving Average crossovers to determine the current trend the
market is in. Using this information it will suggest to ride the trend. Note that this is
not MACD because it just checks whether the longEMA and shortEMA are [threshold]% removed
from each other.
This strategy is fairly popular in bitcoin trading due to Bitcointalk user Goomboo. Read more about this strategy in his topic or here.
You can configure the following parameters:
# EMA weight (α)
# the higher the weight, the more smooth (and delayed) the line
short = 10
long = 21

[thresholds]
down = -0.025
up = 0.025
- short is the short EMA that moves closer to the real market (including noise)
- long is the long EMA that lags behind the market more but is also more resistant to noise.
- the down threshold and the up threshold tell Gekko how big the difference in the lines needs to be for it to be considered a trend. If you set these to 0 each line cross would trigger new advice.
MACD #
The MACD is one of the most popular trend watching indicators in finance, it was created by Gerald Appel in the late 1970s. By using multiple price averages (EMAs) of different periods (one that follows the market more closely and one that lags behind, only catching bigger price swings). The indicator itself ouputs multiple numbers, when comparing them they can be interepted as signals that show when the trend of the price is changing.
The MACD strategy in Gekko is a simple strategy that implements the indicator. By comparing the difference between the EMAs from the signal the strategy triggers buy and sell signals. The strategy does come with additional logic:
- thresholds: a signal will be triggered as soon as the difference goes above or below a configurable threshold, making the strategy more flexible than simply checking if the difference is above or below zero. If you set these to 0 each line cross would trigger new advice.
- persistance: instead of trading as soon the difference is above or below the threshold, the strategy will wait a few candles to see if the difference keeps persisting. Only if it does the strategy will actually signal to Gekko to buy or sell. By setting persistance to 0 this behaviour is disabled.
- short is the short EMA that moves closer to the real market (including noise)
- long is the long EMA that lags behind the market more but is also more resistant to noise.
- signal is the EMA weight calculated over the difference from short/long.
Read more about it here.
You can configure the following parameters:
# EMA weight (α)
# the higher the weight, the more smooth (and delayed) the line
short = 10
long = 21
signal = 9

# the difference between the EMAs (to act as triggers)
[thresholds]
down = -0.025
up = 0.025
# How many candle intervals should a trend persist
# before we consider it real?
persistence = 1
PPO #
Very similar to MACD but also a little different, read more here.
You can configure the following parameters:
# EMA weight (α)
# the higher the weight, the more smooth (and delayed) the line
short = 12
long = 26
signal = 9

# the difference between the EMAs (to act as triggers)
[thresholds]
down = -0.025
up = 0.025
# How many candle intervals should a trend persist
# before we consider it real?
persistence = 2
- short is the short EMA that moves closer to the real market (including noise)
- long is the long EMA that lags behind the market more but is also more resistant to noise.
- signal is the EMA weight calculated over the difference from short/long.
- the down threshold and the up threshold tell Gekko how big the difference in the lines needs to be for it to be considered a trend. If you set these to 0 each line cross would trigger new advice.
- persistence tells Gekko how long the thresholds needs to be met until Gekko considers the trend to be valid.
RSI #
The RSI indicator is and old but ever popular trend watching indicator, introduced in 1978 by J. Welles Wilder this simple indicator has never stopped to be a popular tool for traders. In its essence RSI follows a simple formula to measure the speed by which the price is changing. When the price keeps going up at an accelarating rate the market might be overbought and a reversal might come next.
The RSI strategy in Gekko is a simple strategy that implements the RSI indicator. By calculating the RSI as the market develops this strategy can trigger buy or sell signals based on the RSI going too high (overbought) or too low (oversold). The strategy does come with additional logic:
- interval is the amount of periods the RSI should use.
- thresholds determine what level of RSI would trigger an up or downtrend.
- persistance: instead of trading as soon the difference is above or below the threshold, the strategy will wait a few candles to see if the difference keeps persisting. Only if it does the strategy will actually signal to Gekko to buy or sell. By setting persistance to 0 this behaviour is disabled.
Read more about it here.
You can configure the following parameters:
interval = 14

[thresholds]
low = 30
high = 70
# How many candle intervals should a trend persist
# before we consider it real?
persistence = 2
StochRSI #
The StochRSI indicator uses an RSI indicator at its core and as such is similar to the RSI strategy that uses this indicator. The difference is that after the RSI is calculated a stochastic oscillator is calculated over the resulting RSI values. When a market is trending upwards for a long time the RSI values tend to go and stay high. The stochastic oscillator will compare the RSI values from the last period with eachother. This results in the StochRSI indicator therefor indicate how high or low the RSI values have been historically over the last n periods.
The StochRSI strategy in Gekko is a simple strategy that implements the StochRSI indicator. By calculating the StochRSI as the market develops this strategy can trigger buy or sell signals based on the signal going too high (overbought) or too low (oversold). The strategy does come with configurables:
- interval: This setting defines both the RSI interval used to calculate the RSI values as well as the historical period used by the stochastic oscillator to compare RSI values with.
- persistance: instead of trading as soon the difference is above or below the threshold, the strategy will wait a few candles to see if the difference keeps persisting. Only if it does the strategy will actually signal to Gekko to buy or sell. By setting persistance to 0 this behaviour is disabled.
- thresholds: The high and low thresholds are defined as numbers between 1 and 100. Different from StochRSI in other trading systems, this number indicates a percentage instead of a fraction of 1.
You can configure the following parameters:
interval = 3

[thresholds]
low = 20
high = 80
persistence = 3
CCI #
You can configure the following parameters:
# constant multiplier. 0.015 gets to around 70% fit
constant = 0.015

# history size, make same or smaller than history
history = 90

[thresholds]
up = 100
down = -100
persistence = 0
[TODO!]
talib-macd #
Similar to the default MACD strategy, this showcases how to add a TA-lib indicator to a strategy.
You can configure the following parameters:
[parameters]
optInFastPeriod = 10
optInSlowPeriod = 21
optInSignalPeriod = 9

[thresholds]
down = -0.025
up = 0.025
tulip-macd #
Similar to the default MACD strategy, this showcases how to add a Tulip indicator to a strategy.
You can configure the following parameters:
[parameters]
optInFastPeriod = 10
optInSlowPeriod = 21
optInSignalPeriod = 9

[thresholds]
down = -0.025
up = 0.025
[TODO!]